Benchmarking
What It Is
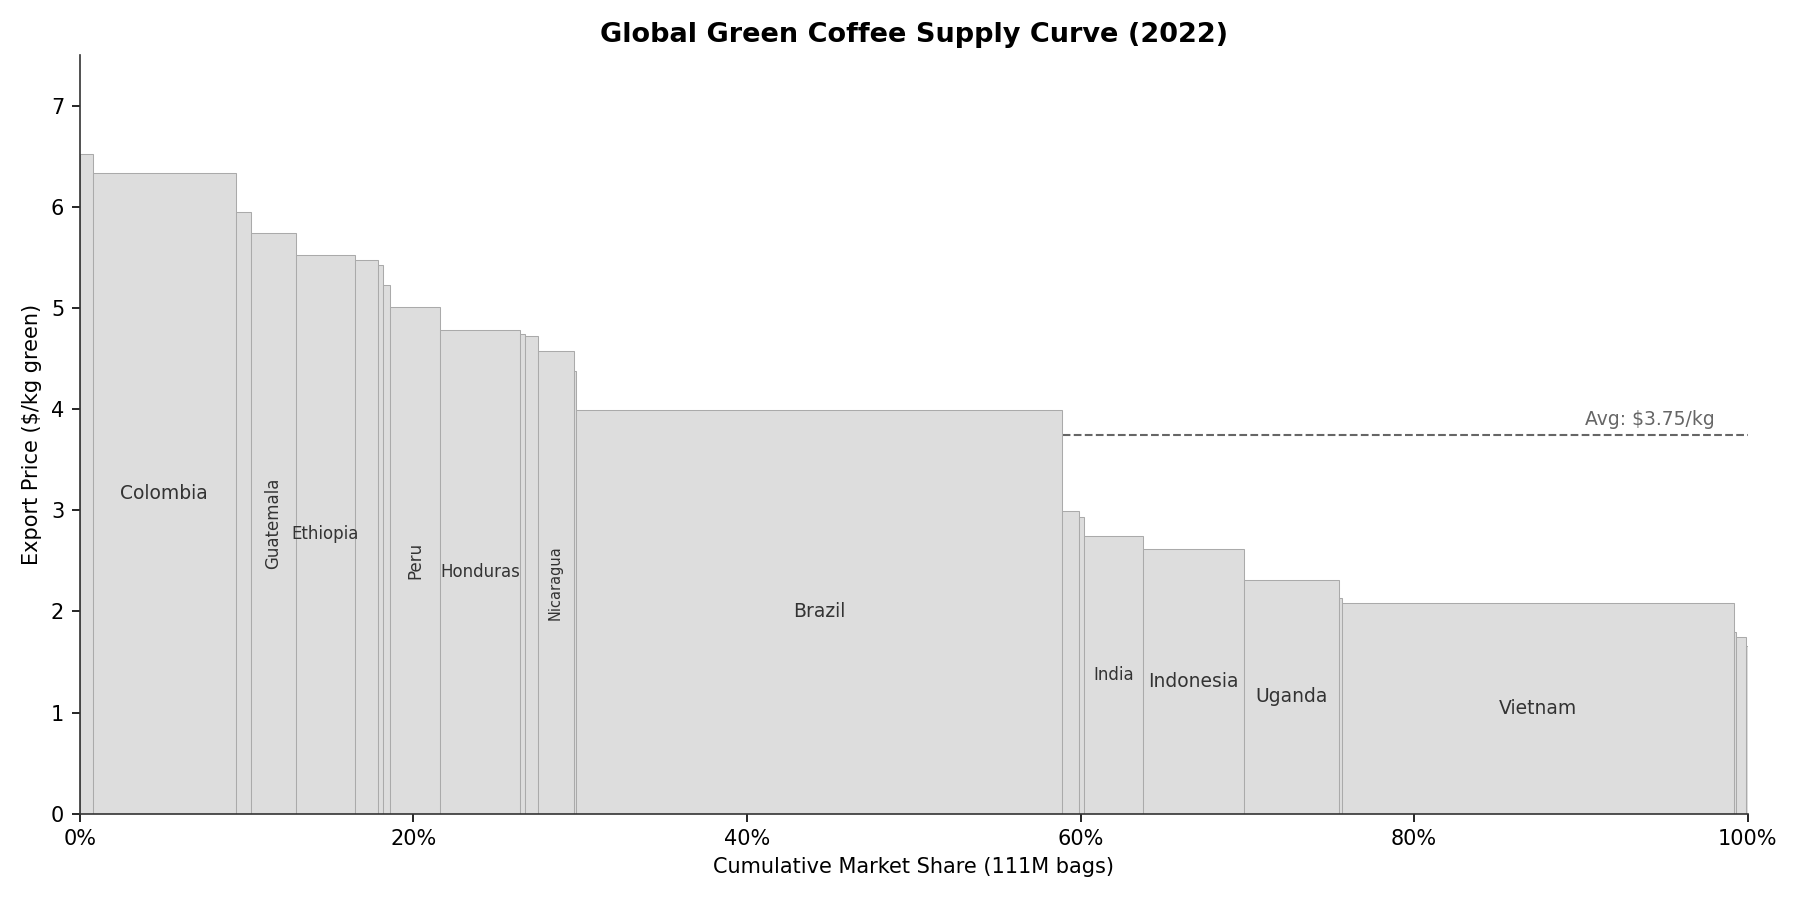
Comparing a value chain's performance against relevant peers to identify strengths, weaknesses, and opportunities. Numbers in isolation mean nothing. A yield of 1.5 MT/ha sounds fine until you learn Vietnam achieves 3+ MT/ha. A farmer share of 54% sounds reasonable until you learn Vietnam's farmers capture 95%. Benchmarking provides the context that turns data into insight.
Why It Matters
Without benchmarks, you cannot distinguish between "this is how the sector works everywhere" and "this is a problem specific to this country that can be fixed." A low farmer share of export price might reflect exploitative intermediaries — or it might reflect legitimate processing costs in a country that produces washed Arabica (which costs more to process than unwashed Robusta). Only comparison reveals which explanation fits.
How to Do It
- Choose comparators carefully. Three types:
- Peer countries, same crop: Rwanda vs Colombia vs Ethiopia (all Arabica producers with significant smallholder sectors). Vietnam vs Brazil Robusta (high-volume producers).
- Same country, different crops: Coffee vs tea vs cocoa in a given country — reveals whether problems are coffee-specific or agriculture-wide.
-
Same country, different time periods: How has Vietnam's yield changed since 2000? Has Rwanda's farmer share improved since the CWS program launched?
-
Select the right metrics. Core metrics for coffee VCA benchmarking:
- Farm yields (metric tons green coffee per hectare): The single most important productivity metric. Range across major origins: Vietnam 3+ MT/ha (highest), Brazil 1.5-2.0, Costa Rica ~1.5, Colombia ~1.0, Honduras ~0.8, Rwanda ~0.6, Indonesia ~0.6, Ethiopia <0.5 (lowest among major origins).
- Prices received (USD/kg green equivalent): What farmers actually get. Reflects quality, market positioning, and supply chain efficiency.
- Farmer share of export price: Percentage of FOB price reaching the farmer. Most countries are above 50%. Vietnam and Brazil are best in class at >90%. Latin America (Colombia, Honduras) typically ~80%. Africa shows the most variation: Ethiopia ~55-65% (varies by channel — cooperative washed is higher, unwashed/ECX is lower), Rwanda ~54% (the low end globally).
- Cost of production (USD/kg green): What it costs to grow. If cost exceeds price, farmers are losing money.
-
Export volume and market share: How much the country contributes to global supply. Brazil ~35%, Vietnam ~20%, Colombia ~10%, Rwanda <1%.
-
Normalize for comparability. Same units (USD/kg green), same product form, same or comparable time period. Comparing a 2018 Rwanda price to a 2025 Vietnam price without adjusting for the coffee market swing is meaningless.
-
Interpret differences. Not all gaps are fixable. Differences may be:
- Structural: Vietnam's high yields partly reflect Robusta (inherently higher-yielding than Arabica), flat terrain, and irrigation infrastructure. Rwanda cannot replicate this with hillside Arabica plots.
- Policy-driven: Vietnam's government provided land rights, credit access, and competition-friendly regulation. These are replicable with political will.
- Market-driven: Rwanda earns a premium price per kg because of quality positioning. Vietnam earns less per kg but far more per hectare.
Common Mistakes
-
Comparing Robusta and Arabica without adjusting. These are fundamentally different products with different agronomy, different price levels, and different markets. Vietnam (Robusta) vs Colombia (Arabica) is an apples-to-oranges comparison unless you account for the species difference. Compare Robusta to Robusta, Arabica to Arabica, or explicitly note the comparison is cross-species and adjust accordingly.
-
Cherry-picking comparators to support a predetermined conclusion. If you want to make Rwanda look good, compare it to Burundi. If you want to make it look bad, compare it to Vietnam. Honest benchmarking selects comparators based on structural similarity (farm size, species, market position), not on which comparison produces the desired result.
-
Treating national averages as representative. A national average yield of 1.0 MT/ha might mask a range from 0.3 (neglected smallholdings) to 2.5 (well-managed commercial farms). If your recommendations target the average farmer, you are targeting nobody. Where possible, benchmark at the regional or producer-segment level.
-
Ignoring context that explains differences. Vietnam's yields are high partly because of massive irrigation in the Central Highlands — which consumes 2,822 tons of water per household per year. The yield benchmark looks impressive until you factor in the environmental cost. Always ask: what is the story behind the number?
-
Benchmarking on a single metric. A country with high yields but low prices (Vietnam) and a country with low yields but high prices (Ethiopia) look very different depending on which metric you choose. Use multiple metrics. The most useful analysis compares income per hectare (yield × price - cost), which integrates all three dimensions.